Mathematical models are central to S&W's work. Already during their time at the Institute of Spatial Planning of the University of Dortmund, the partners of S&W had developed and applied the SASI and IRPUD models still used today, the latter even carries the name of its former home, IRPUD. Both models have been further developed and extended and applied in several research projects for the European Commission and national and regional authorities. The environmental impacts model called the Raster model originated in the PROPOLIS project. Most recently the "little" ILUMASS model, a reduced version of the comprehensive microsimulation ILUMASS model was added. This page collects information on all four models common to all projects in which they are applied:
SASI Model
 The regional economic model SASI was developed at the Institute of Spatial Planning of the University of
Dortmund since 1996 in co-operation with the Technical University of Vienna in the EU project SASI (Spatial and
Socio-economic Impacts of Transport Investments and Transport System Improvements). The model has
since been applied in several EU projects, such as IASON (Integrated Appraisal of Spatial Economic
and Network Effects of Transport Investments and Policies), ESPON 2.1.1
(Territorial Impacts of EU Transport and TEN Policy) of the European Spatial Planning Observation Network
(ESPON), the Interreg-IIIb project AlpenCorS (Alpen Corridor South) and
STEPs (Scenarios for the Transport System and Energy Supply and their Potential Effects).
More information on page SASI Model.
The regional economic model SASI was developed at the Institute of Spatial Planning of the University of
Dortmund since 1996 in co-operation with the Technical University of Vienna in the EU project SASI (Spatial and
Socio-economic Impacts of Transport Investments and Transport System Improvements). The model has
since been applied in several EU projects, such as IASON (Integrated Appraisal of Spatial Economic
and Network Effects of Transport Investments and Policies), ESPON 2.1.1
(Territorial Impacts of EU Transport and TEN Policy) of the European Spatial Planning Observation Network
(ESPON), the Interreg-IIIb project AlpenCorS (Alpen Corridor South) and
STEPs (Scenarios for the Transport System and Energy Supply and their Potential Effects).
More information on page SASI Model.
IRPUD Model
 The IRPUD model of the eastern part of the Ruhr area is a dynamic simulation model of intraregional location
and mobility decisions in an urban region. It was developed in a project for the German Research Council
at the Institute of Spatial Planning of the University of Dortmund since 1977 and has been applied in several
projects for the European Commission and regional authorities, such as the EU projects
PROPOLIS (Planning and Research of Policies for Land Use and Transport for Increasing Urban
Sustainability) and STEPs (Scenarios for the Transport System and
Energy Supply and their Potential Effects) and the project "Analysis of Central Constraints, Instruments
and Goal Criteria for state transport planning in North-Rhine Westphalia". More information on page
IRPUD Model.
The IRPUD model of the eastern part of the Ruhr area is a dynamic simulation model of intraregional location
and mobility decisions in an urban region. It was developed in a project for the German Research Council
at the Institute of Spatial Planning of the University of Dortmund since 1977 and has been applied in several
projects for the European Commission and regional authorities, such as the EU projects
PROPOLIS (Planning and Research of Policies for Land Use and Transport for Increasing Urban
Sustainability) and STEPs (Scenarios for the Transport System and
Energy Supply and their Potential Effects) and the project "Analysis of Central Constraints, Instruments
and Goal Criteria for state transport planning in North-Rhine Westphalia". More information on page
IRPUD Model.
Raster Model
 The Raster model is a disaggregate model of environmental impacts of urban land use and transport. It was
developed in the EU project PROPOLIS (Planning and Research
of Policies for Land Use and Transport for Increasing Urban Sustainability). Combined with a land-use transport
model as the IRPUD model, the Raster model calculates for a given set of land use and traffic flow data energy
consumption, greenhouse gas emissions, biodiversity and loss of open space and spatially disaggregate
indicators for air quality and noise intrusion, taking account of the disaggregate distribution of residential
population. More information on page Raster Model.
The Raster model is a disaggregate model of environmental impacts of urban land use and transport. It was
developed in the EU project PROPOLIS (Planning and Research
of Policies for Land Use and Transport for Increasing Urban Sustainability). Combined with a land-use transport
model as the IRPUD model, the Raster model calculates for a given set of land use and traffic flow data energy
consumption, greenhouse gas emissions, biodiversity and loss of open space and spatially disaggregate
indicators for air quality and noise intrusion, taking account of the disaggregate distribution of residential
population. More information on page Raster Model.
ILUMASS Model
 The ILUMASS model is an integrated, completely microsimulation-based simulation model of land use, transport
and environmental impacts in urban regions. It was developed in the project
ILUMASS (Integrated Land Use Modelling and Transportation System Simulation) funded by the
German Federal Minstry for Education and Research. For test purposes, S&W and the Institute of Spatial Planning
of the University of Dortmund implemented the little ILUMASS model, a reduced version of the ILUMASS
model in which the time-consuming microsimulation of traffic flows was replaced by the existing more aggregate
transport model of the IRPUD model. More information on page
ILUMASS Model.
The ILUMASS model is an integrated, completely microsimulation-based simulation model of land use, transport
and environmental impacts in urban regions. It was developed in the project
ILUMASS (Integrated Land Use Modelling and Transportation System Simulation) funded by the
German Federal Minstry for Education and Research. For test purposes, S&W and the Institute of Spatial Planning
of the University of Dortmund implemented the little ILUMASS model, a reduced version of the ILUMASS
model in which the time-consuming microsimulation of traffic flows was replaced by the existing more aggregate
transport model of the IRPUD model. More information on page
ILUMASS Model.
Time-Space Maps
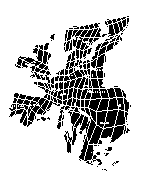 Modern transport technologies reduce the time to overcome space; measured in units of time, space is 'shrinking'.
Time-space maps represent this interaction between space and time cartographically. In time-space maps the
distance between two points is not proportional to their physical distance (as in physical maps) but proportional
to the travel time between them. This change of map scale leads to distortions of the map compared with 'familiar'
physical maps. Time-space maps are particularly useful for visualising the effects of network improvements
over time. More informationen and examples of time-space maps on page
Time-space maps.
Modern transport technologies reduce the time to overcome space; measured in units of time, space is 'shrinking'.
Time-space maps represent this interaction between space and time cartographically. In time-space maps the
distance between two points is not proportional to their physical distance (as in physical maps) but proportional
to the travel time between them. This change of map scale leads to distortions of the map compared with 'familiar'
physical maps. Time-space maps are particularly useful for visualising the effects of network improvements
over time. More informationen and examples of time-space maps on page
Time-space maps.